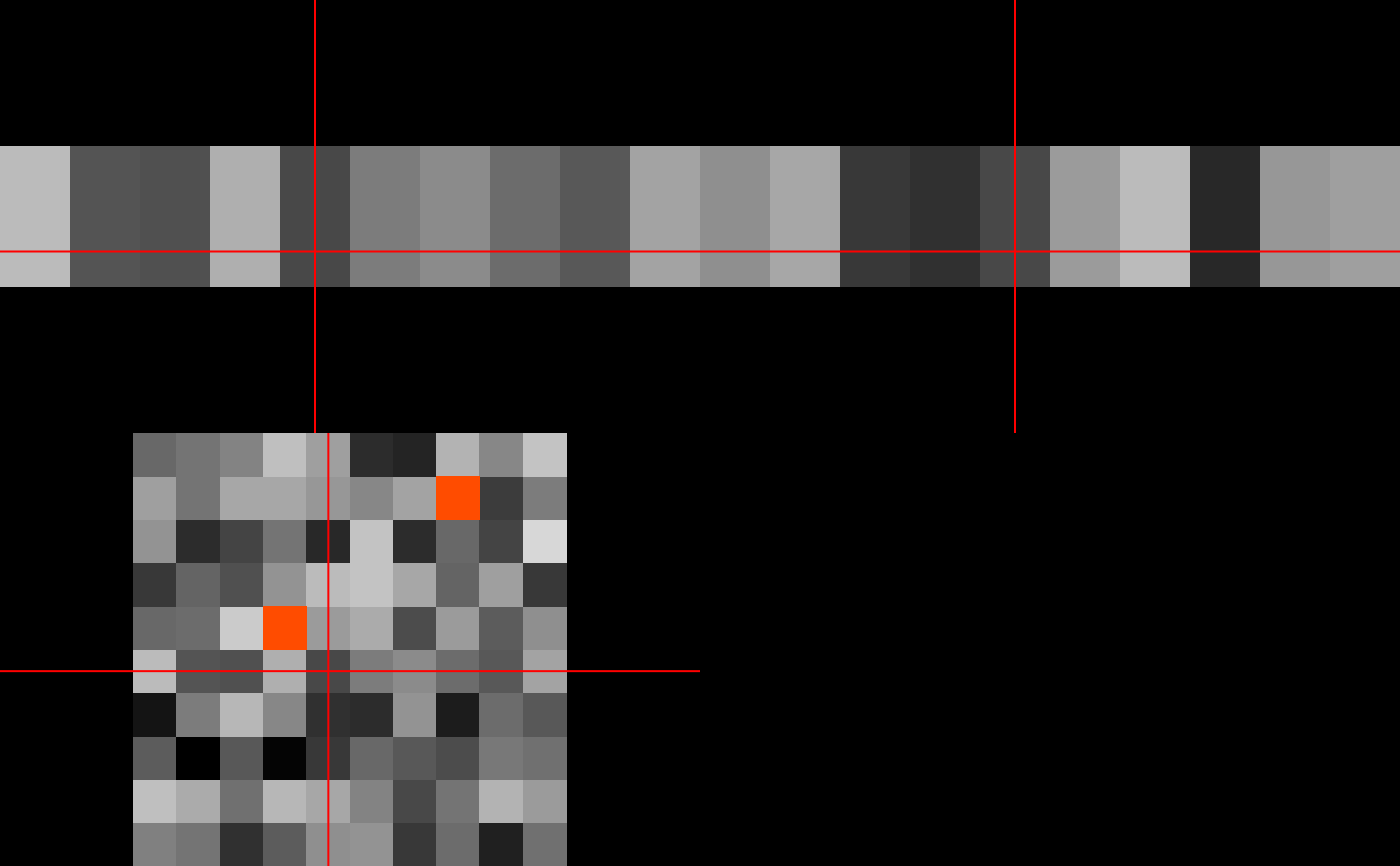
Copy of oro.nifti's orthographic function
with some tweaks such as adding L/R designations for left and right
ortho2(
  x,
  y = NULL,
  xyz = NULL,
  w = 1,
  col = gray(0:64/64),
  col.y = oro.nifti::hotmetal(),
  zlim = NULL,
  zlim.y = NULL,
  NA.x = FALSE,
  NA.y = TRUE,
  crosshairs = TRUE,
  col.crosshairs = "red",
  xlab = "",
  ylab = "",
  axes = FALSE,
  oma = c(0, 0, 0, ifelse(ycolorbar, 5, 0)),
  mar = rep(0, 4),
  bg = "black",
  text = NULL,
  text.color = "white",
  text.cex = 2,
  text.x = 32,
  text.y = 32,
  add.orient = FALSE,
  mfrow = c(2, 2),
  ybreaks = NULL,
  breaks = NULL,
  addlegend = FALSE,
  leg.x = 32,
  leg.y = 32,
  legend,
  leg.col,
  leg.title = NULL,
  leg.cex,
  window = NULL,
  ycolorbar = FALSE,
  clabels = TRUE,
  add = TRUE,
  pdim = NULL,
  useRaster = is.null(y),
  mask = NULL,
  ...
)
Arguments
| x | is an object of class nifti or similar. |
|---|---|
| y | is an object of class nifti or similar for the overlay. |
| xyz | is the coordinate for the center of the crosshairs. |
| w | is the time point to be displayed (4D arrays only). |
| col | is grayscale (by default). |
| col.y | is hotmetal (by default). |
| zlim | is the minimum and maximum `z' values passed into image. |
| zlim.y | is the minimum and maximum `z' values passed into image for the overlay. |
| NA.x | Set any values of 0 in |
| NA.y | Set any values of 0 in |
| crosshairs | is a logical value for the presence of crosshairs in all three orthogonal planes (default = TRUE). |
| col.crosshairs | is the color of the crosshairs (default = red). |
| xlab | is set to "" since all margins are set to zero. |
| ylab | is set to "" since all margins are set to zero. |
| axes | is set to FALSE since all margins are set to zero. |
| oma | is the size of the outer margins in the par function. |
| mar | is the number of lines of margin in the par function. |
| bg | is the background color in the par function. |
| text | allows the user to specify text to appear in the fourth (unused) pane. |
| text.color | is the color of the user-specified text (default = ``white"). |
| text.cex | is the size of the user-specified text (default = 2). |
| text.x | x coordinate for text |
| text.y | y coordinate for text |
| add.orient | (logical) Add left/right, A/P, etc. orientation |
| mfrow | (numeric) layout of the 3 slices |
| ybreaks | (numeric) breaks for y to passed to
|
| breaks | (numeric) breaks for x to passed to
|
| addlegend | (logical) add legend? |
| leg.x | (numeric) x coordinate for legend |
| leg.y | (numeric) y coordinate for legend |
| legend | (character) legend text |
| leg.col | (character) Colors for legend |
| leg.title | (character) title for legend |
| leg.cex | (numeric) |
| window | (vector) Length-2 vector to limit image to certain range |
| ycolorbar | (logical) Should a colorbar for |
| clabels | Label for colorbar (see |
| add | Should the y-plot be added or its own plot? Used
in |
| pdim | Pixel dimensions if passing in arrays. Will be overridden if
|
| useRaster | logical; if TRUE a bitmap raster is used to
plot the image instead of polygons. Passed to
|
| mask | If a mask is passed, |
| ... | other arguments to the image function may be provided here. |
See also
Examples
set.seed(10)
x = oro.nifti::nifti(array(rnorm(1000), dim = rep(10, 3)))
ortho2(x)
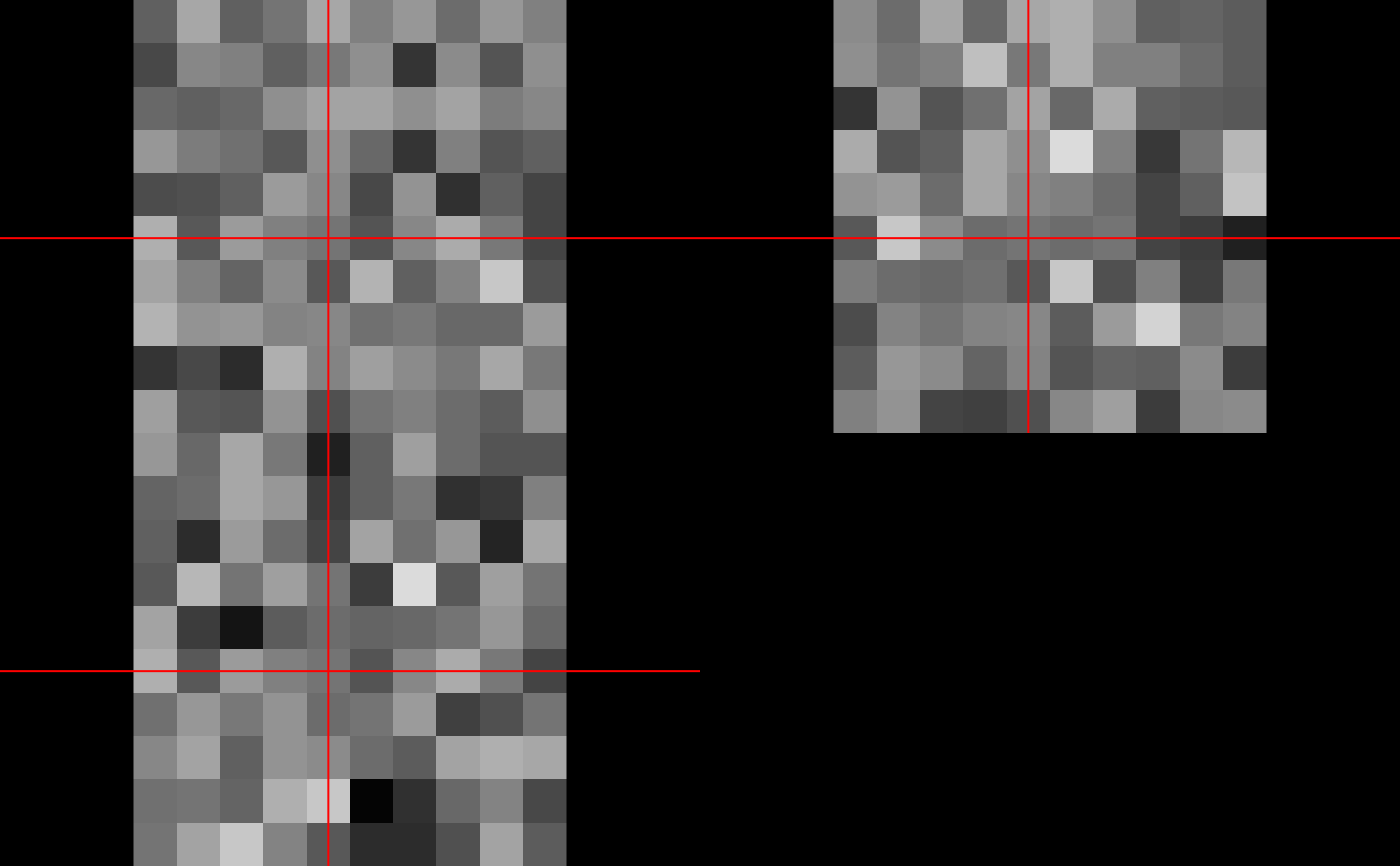 y = x > 2
mask = x > 2.5
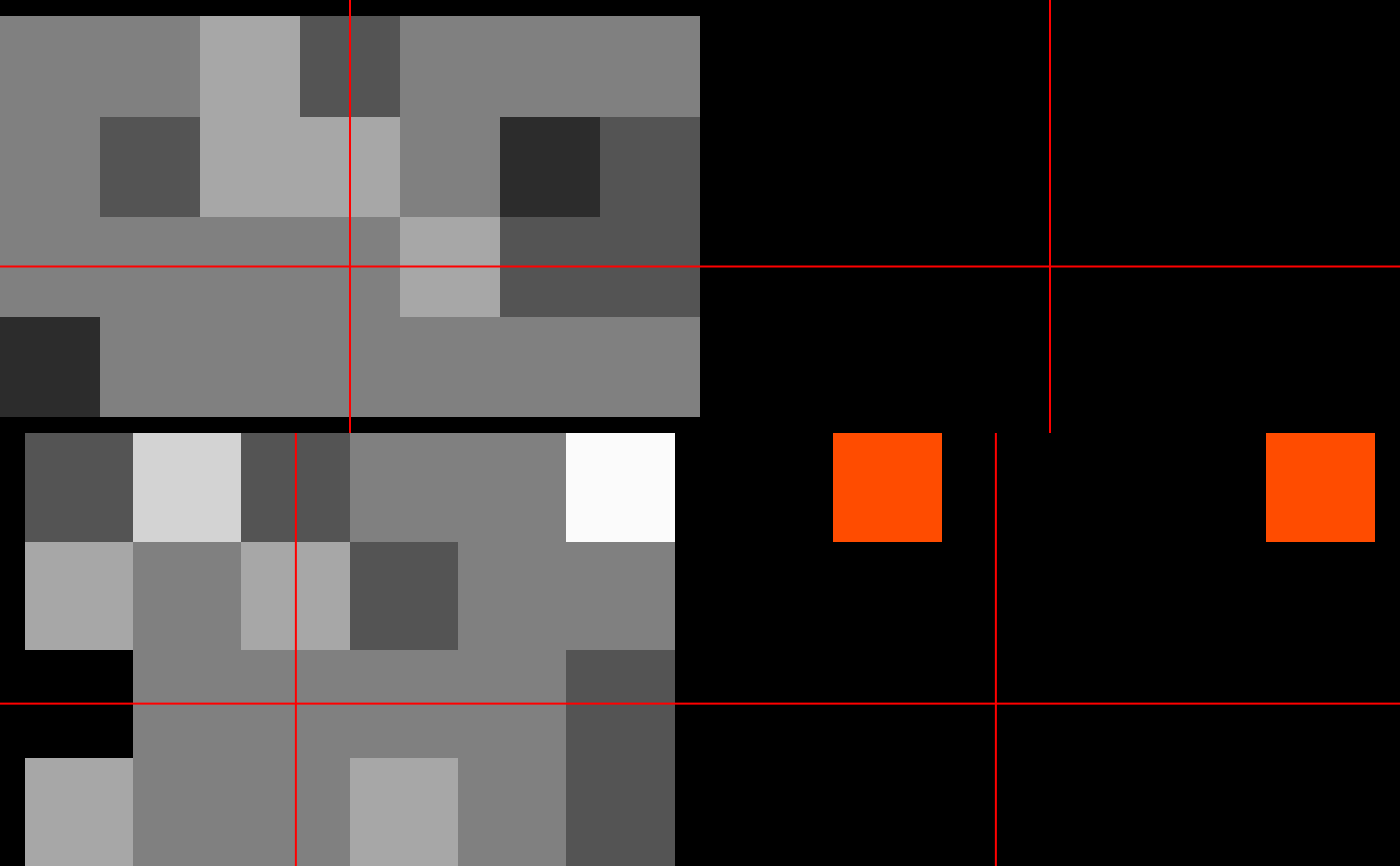
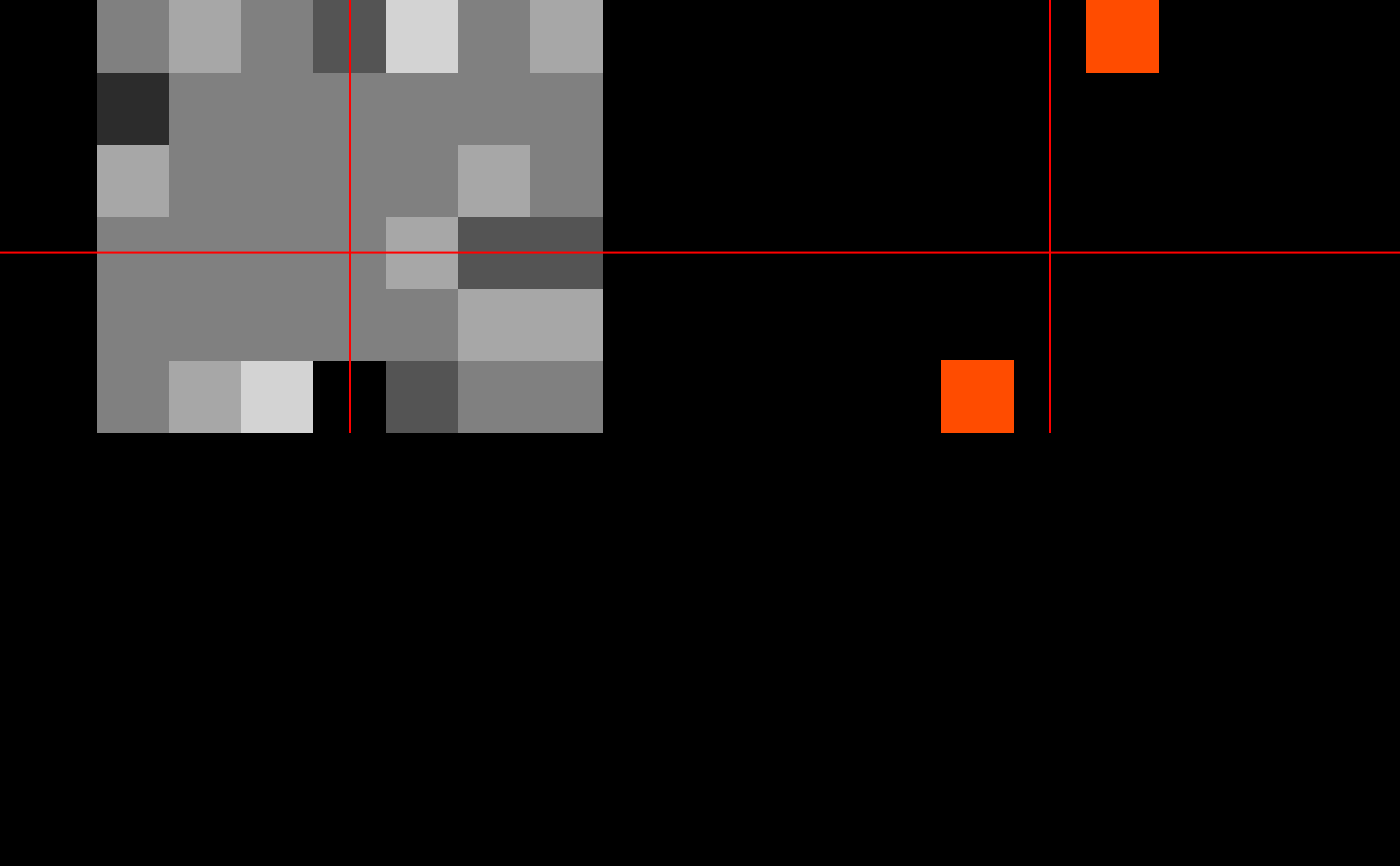
ortho2(x, y)
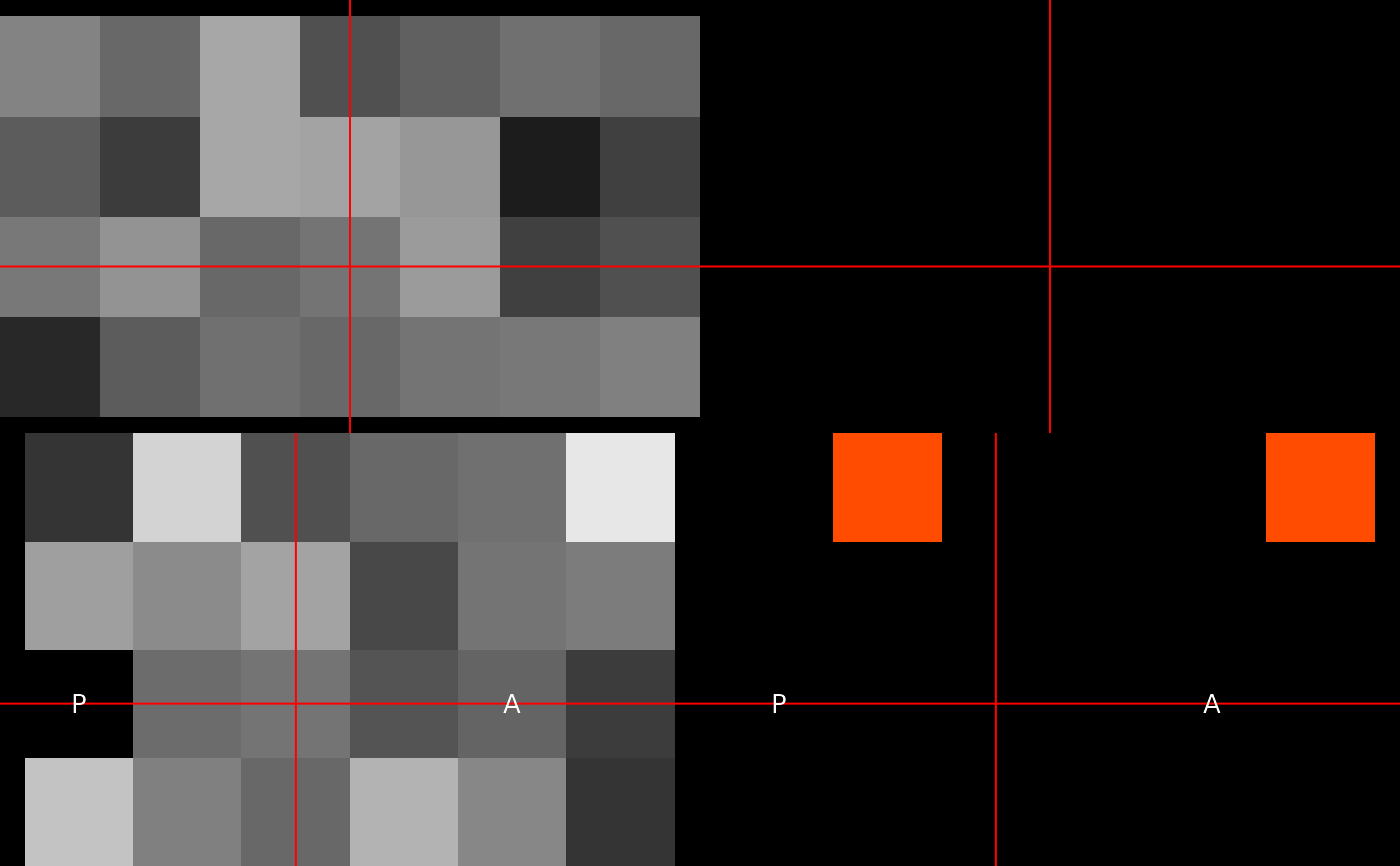
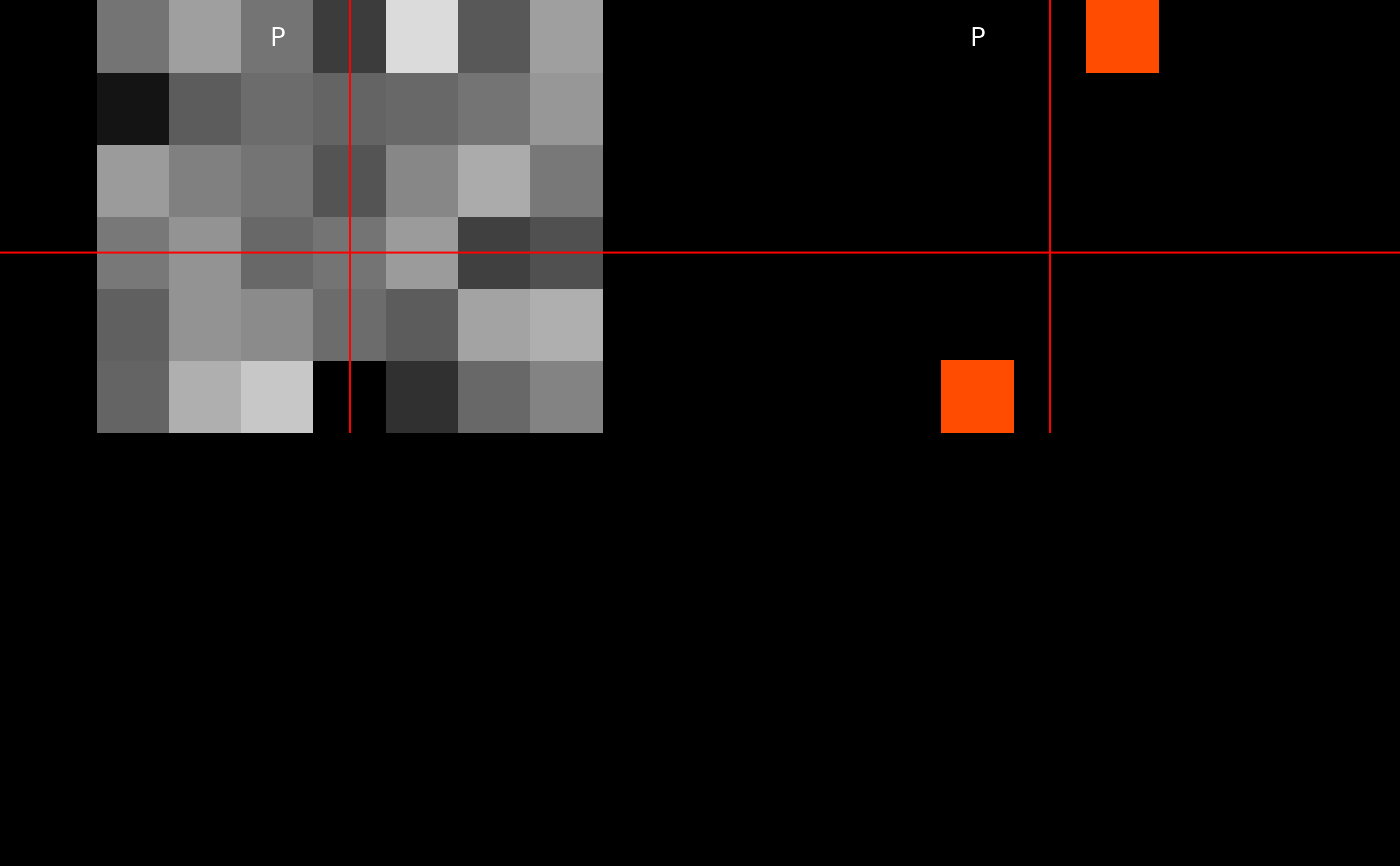
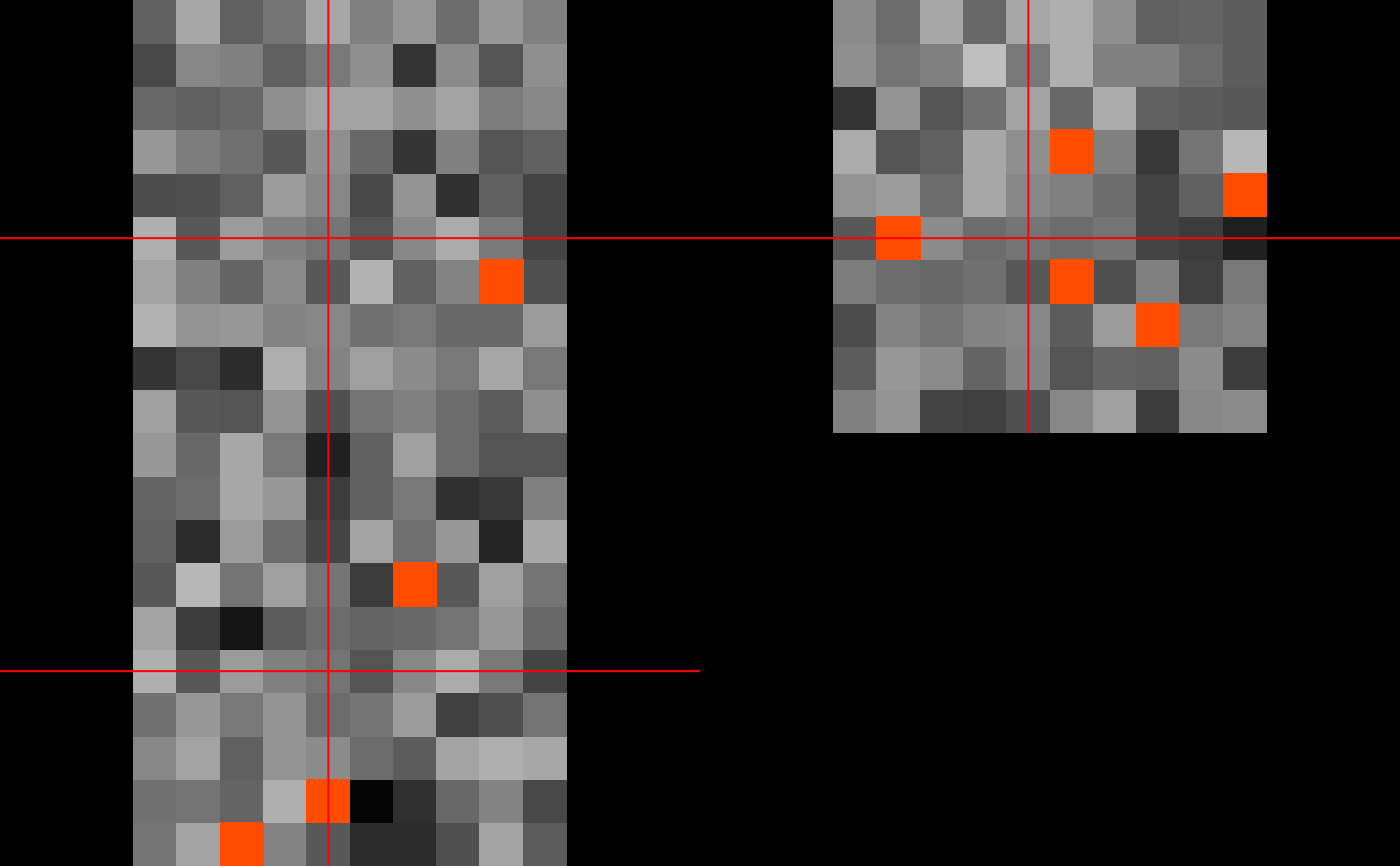 ortho2(x, y, mask = mask, add.orient = TRUE)
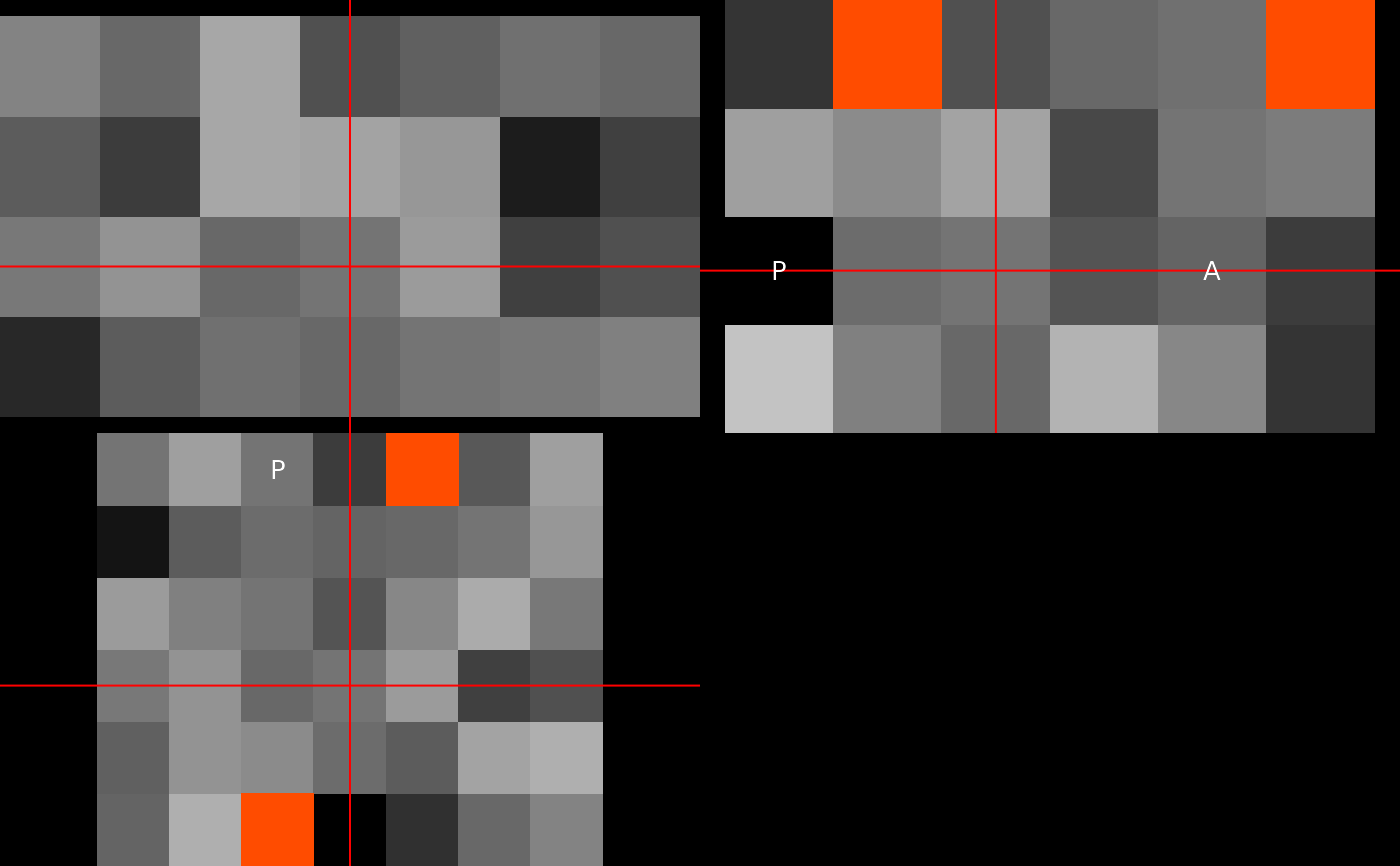 ortho2(x, y, mask = mask, add.orient = TRUE, add = FALSE)
 nim = RNifti::asNifti(x, internal = FALSE)
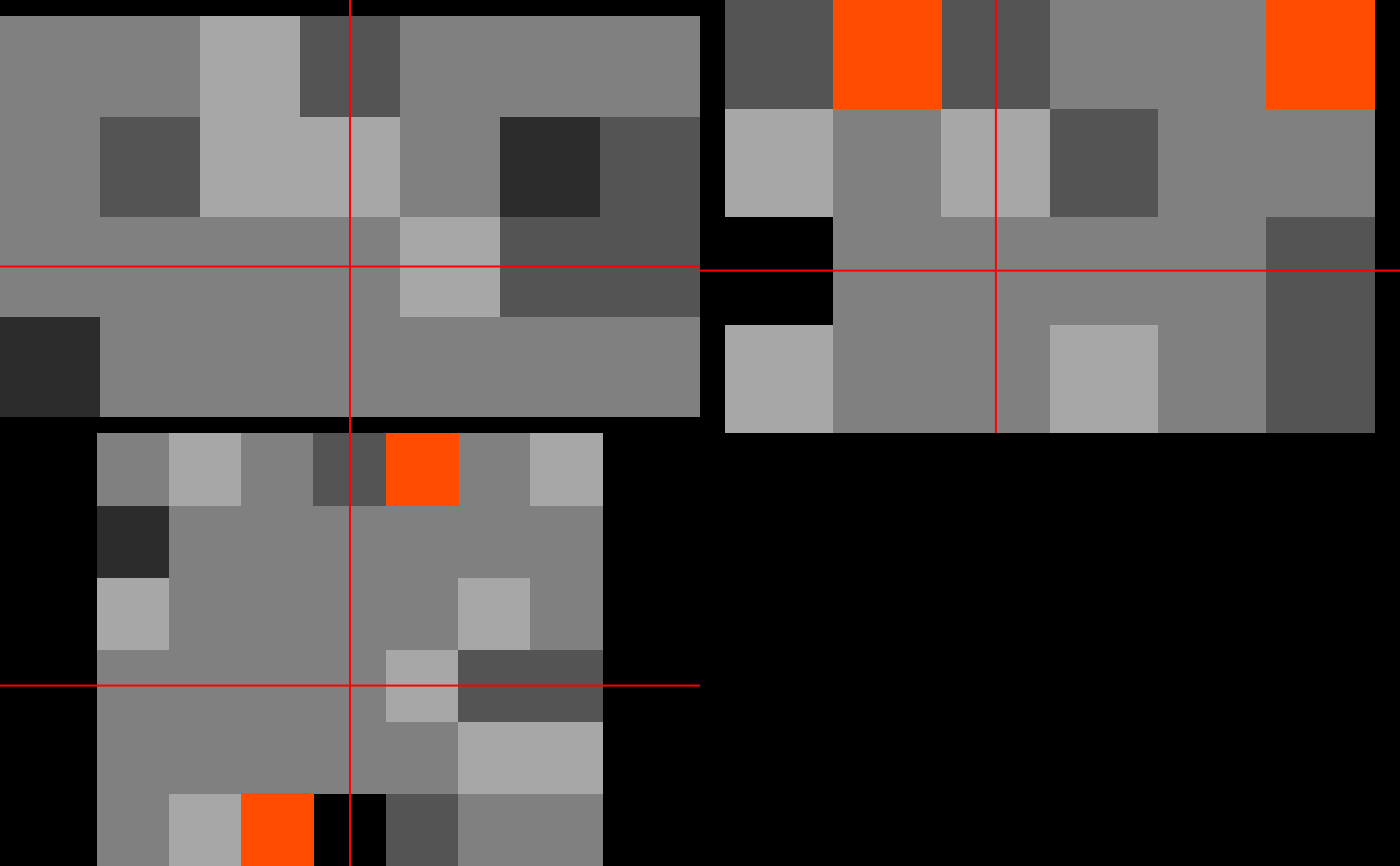
ortho2(nim, y, mask = mask)
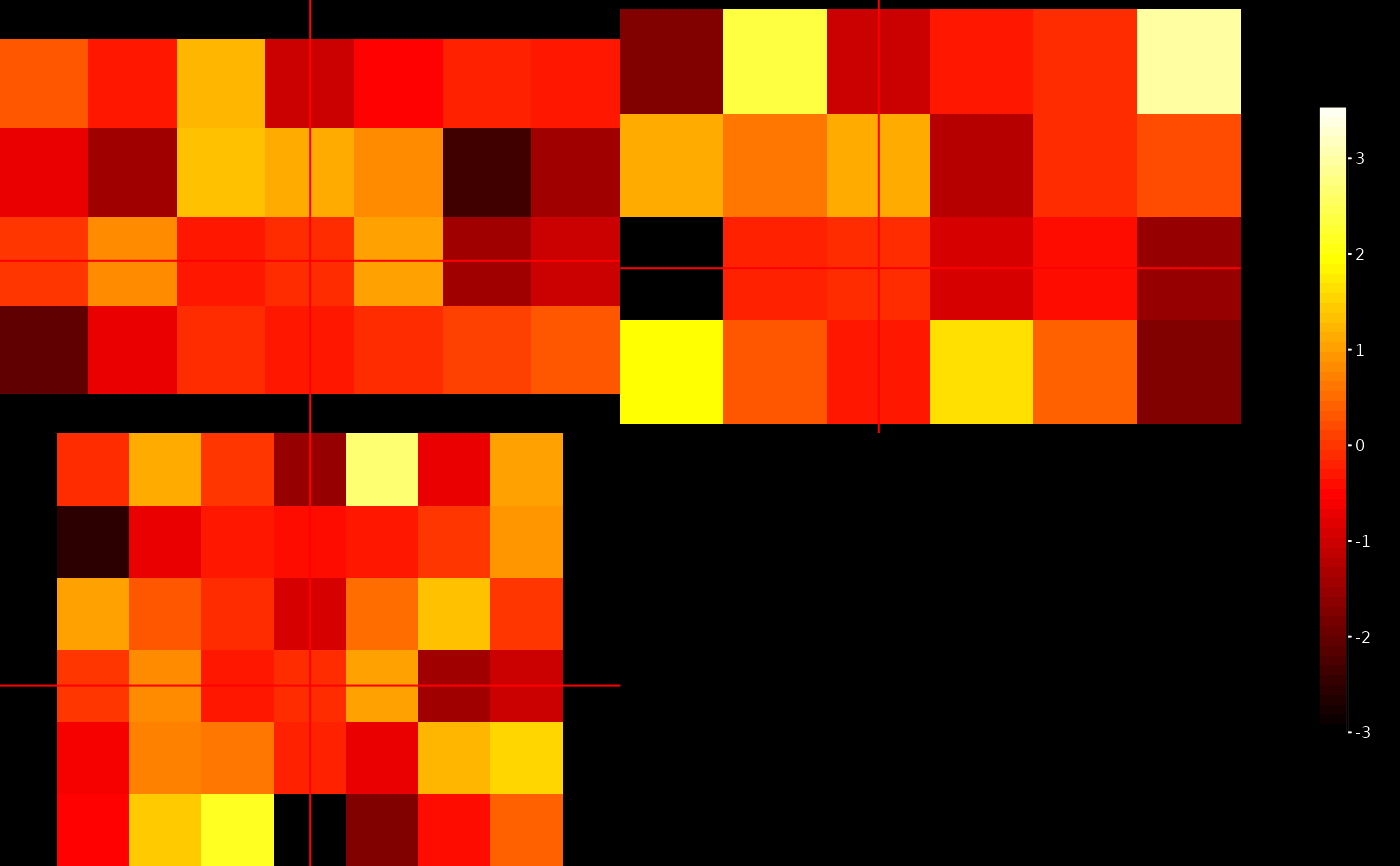
 ortho2(nim, x, mask = mask,
ybreaks = seq(min(x), max(x), length.out = 65), ycolorbar = TRUE)
 ortho2(nim, y, mask = mask, add = FALSE)
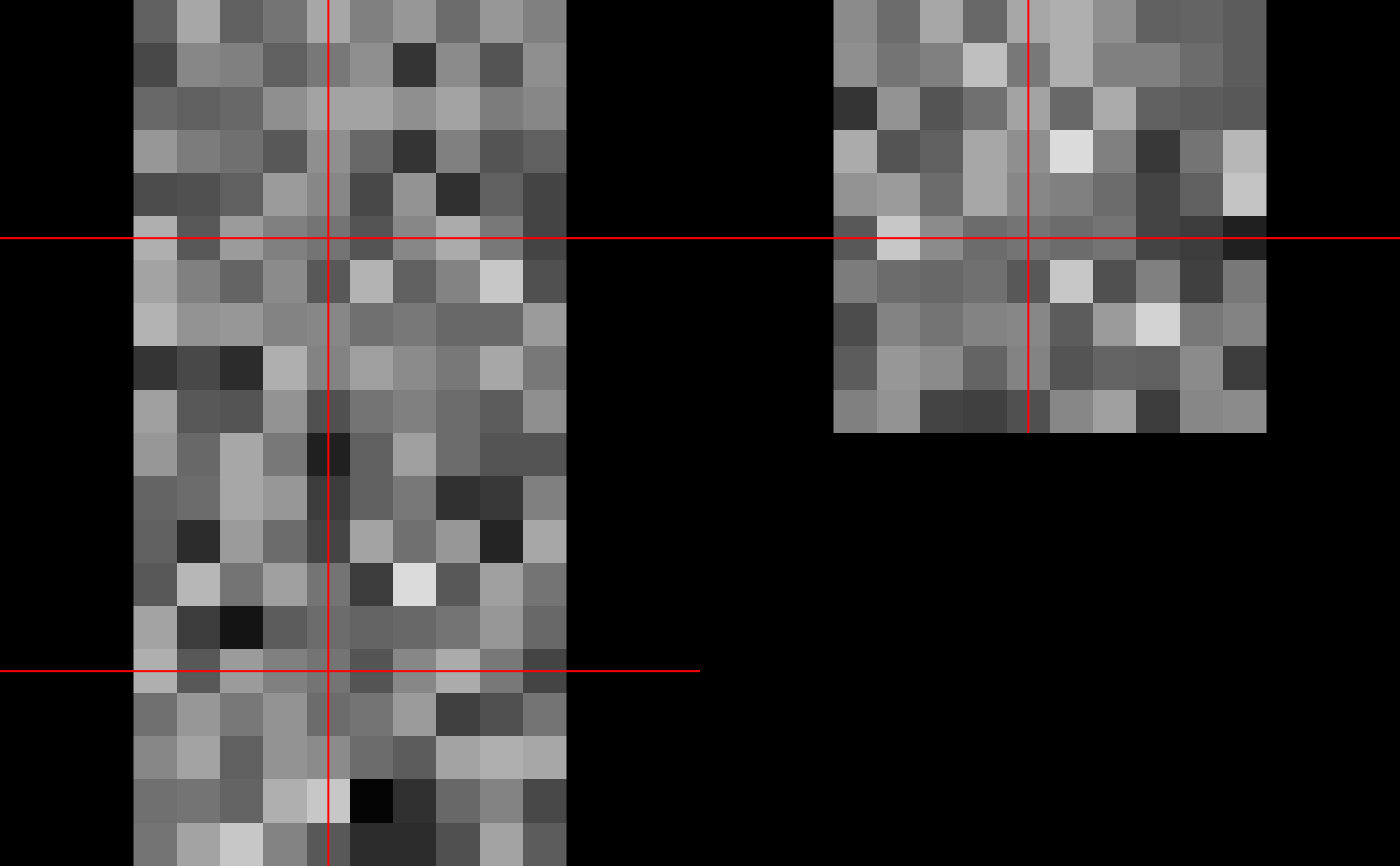
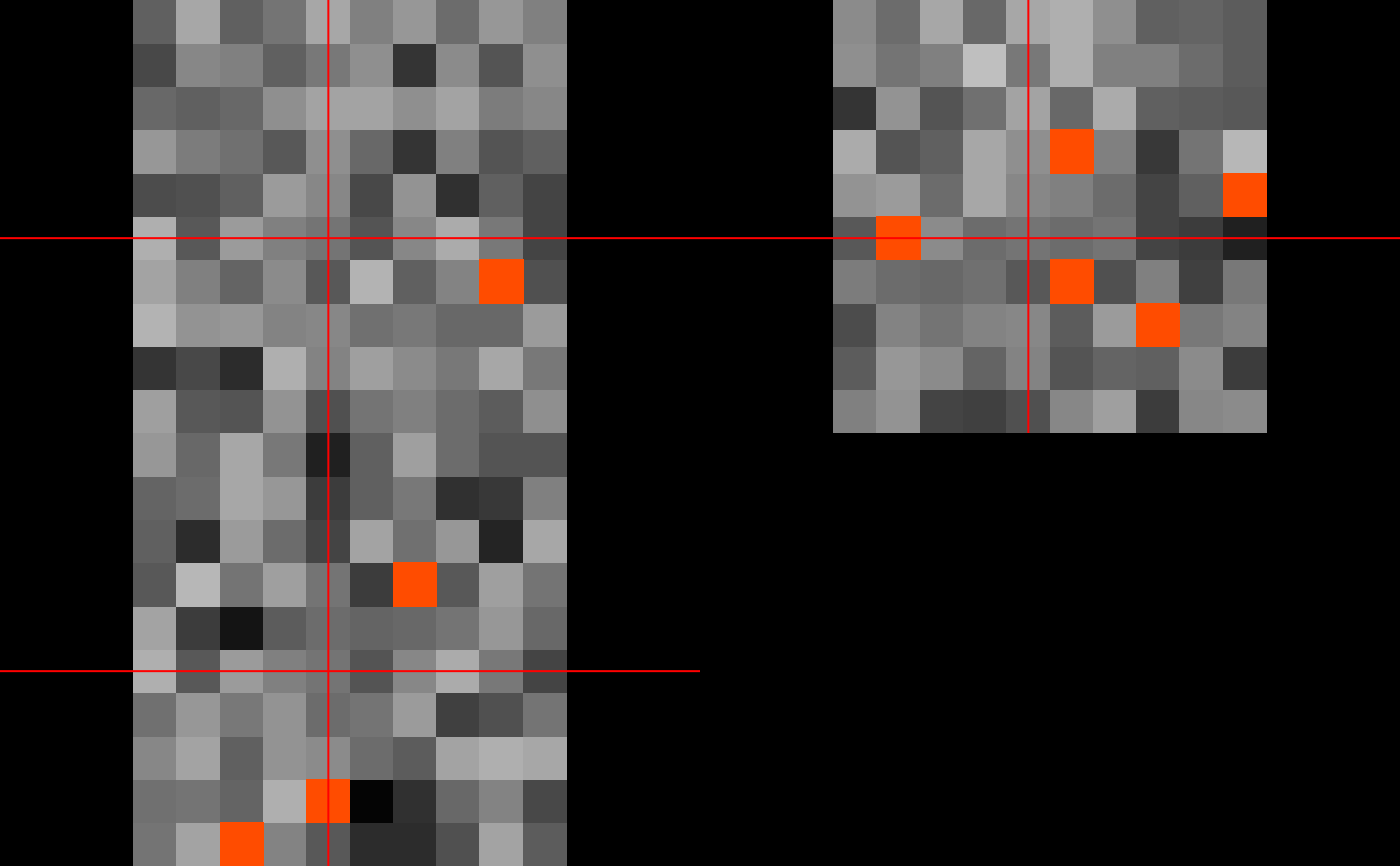
 arr_x = as.array(x)
arr_y = as.array(y)
ortho2( arr_x)
 ortho2( arr_x, arr_y, useRaster = FALSE)
 set.seed(10)
x = oro.nifti::nifti(array(rnorm(10000), dim = rep(10, 4)))
y = x > 2
mask = x > 2.5
ortho2(x, y)
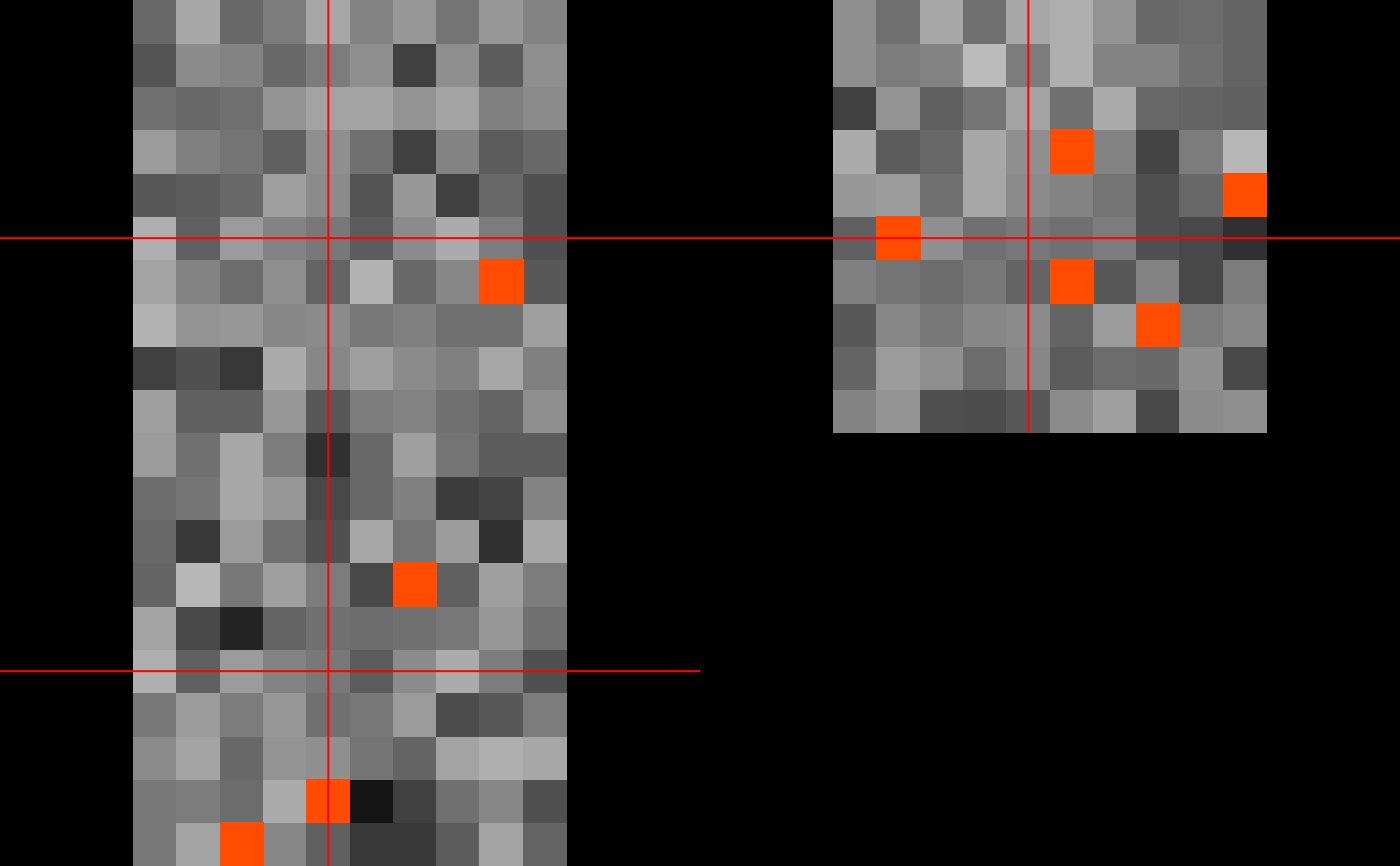 set.seed(10)
x = oro.nifti::nifti(array(rnorm(100), dim = rep(10, 2)))
y = x > 2
mask = x > 2.5
ortho2(x, y)
