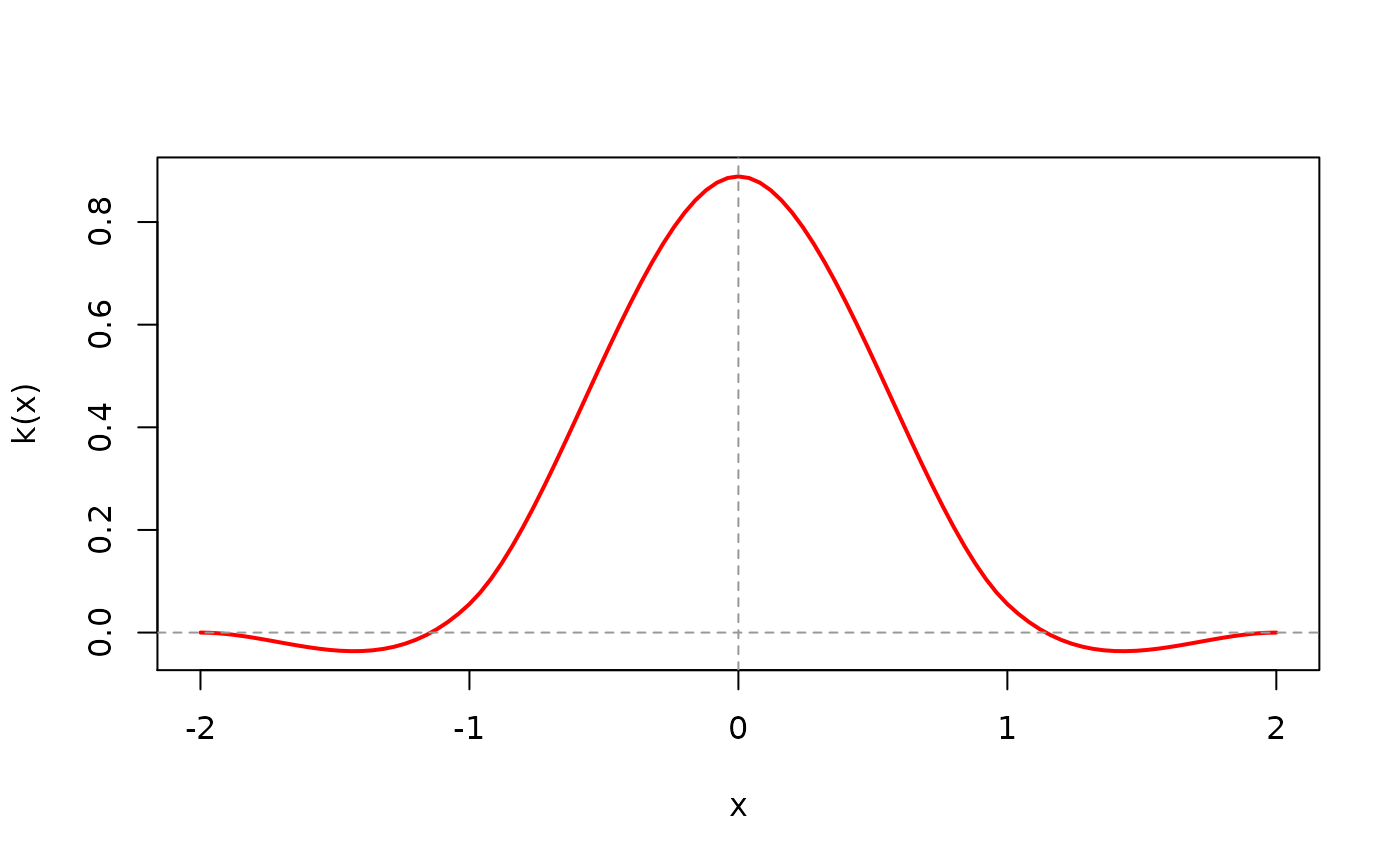
These functions can be used to sample and plot kernel profiles.
sampleKernelFunction(kernel, values)

# S3 method for kernelArray
plot(x, y, axis = 1, lwd = 2, col = "red", ...)

# S3 method for kernelFunction
plot(x, y, xlim = c(-2, 2), lwd = 2, col = "red", ...)
Arguments
| kernel | A kernel function object. |
|---|---|
| values | A vector of values to sample the function at. These are in units of pixels, with zero representing the centre of the kernel. |
| x | A kernel object of the appropriate class. |
| y | Ignored. |
| axis | The axis to profile along. |
| lwd | The line width to use for the kernel profile. |
| col | The line colour to use for the kernel profile. |
| ... | Additional plot parameters. |
| xlim | The limits of the range used to profile the kernel. |
Value
For sampleKernelFunction a vector of kernel values at the
locations requested. The plot methods are called for their
side-effects.
See also
kernels for kernel-generating functions.
Author
Jon Clayden <code@clayden.org>